Page 2 of 3

Posted: Tue Oct 04, 2022 3:22 pm
by Petr
Martin,

there's only one program that calculates the heliacal phases with respect to three basic parameters:

1) The magnitude of the planet or star.
2) The atmospheric extinction coefficient.
3) The difference in azimuths of the sun and the planet.

It's Porphyrius Magus 2 by Rumen Kolev.

Posted: Tue Oct 04, 2022 7:52 pm
by Martin Gansten
Thanks, Petr. Have you compared the output of Porphyrius Magus (with respect to heliacal rising/setting) with that of Alcyone? Considering that one is freeware and the other is apparently $250, that would seem relevant...

Posted: Tue Oct 04, 2022 11:00 pm
by Cruiser1
Image
Astrolog the free astrology program can compute planet visibility graphs for a year (like how the Alcyone program does) with an example Astrolog screenshot seen above. :D You can include multiple bodies in Astrolog's visibility graph, for example the above shows at a glance that the only times you can see both Jupiter and Venus at the same time (i.e. when both Jupiter and Venus are above the horizon, and when the Sun is below the horizon) are in the early morning hours between May and October, and also the early evening hours in December.

Astrolog can take into account elevation above sea level, and also atmospheric refraction (which in turn takes temperature into account) all of which affect where a planet appears in the sky. It can also do local horizon skygazing charts indicating the azimuth and altitude of planets and stars, such as seen below:
Image

Posted: Wed Oct 05, 2022 6:38 am
by Martin Gansten
Cruiser1 wrote:Astrolog the free astrology program can compute planet visibility graphs for a year (like how the Alcyone program does) with an example Astrolog screenshot seen above.
Can it also produce a table/list of dates in simple text format, like Alcyone, for us left-brainers? ;) I confess I find the multicolour graph unintelligible (it doesn't communicate anything at all to me 'in a glance', whereas a text table does). It reminds me of the sort of abstract art often found in public venues.

Perhaps more to the point, do you know if Astrolog and Alcyone agree in their output, or, if not, how great the differences are and what causes them?

Posted: Wed Oct 05, 2022 7:47 am
by Ouranos
As for the visibility of the planets, my reference remains "Ardua et Astra: On the Calculation of the Dates of the Rising and Setting of Stars' by Matthew Robinson from University College London
https://www.journals.uchicago.edu/doi/10.1086/650145

Petr9 has developed many visibility aspects in Astro-Seek for Venus, Mercury and Mars. Under Planetary Cycles.
As Martin mentioned, we would need a tool for all planets with dates and times. Alcyone provides the 'Apparent Morning Rising' (first visibility) and 'Apparent Evening Setting' (last visibility).
The cosmical rising and setting can be approached on the website In-The-Sky.org by looking at the Altitude of the planets but I am not sure if the ancient literature considered these factors as their approach was centered on the 'visibility' of the planets. That remains a grey area for me right now.

Resume of Matthew Robinson article and the terminology.
Page 3
"The ‘true’ risings and settings take place when the star crosses the horizon at the same time as the sun: as the sky is still bright at this time, these phenomena cannot be observed and the dates can only be reached by calculation. The ‘apparent’ risings and settings take place just before sunrise or just after sunset, when the sky is just dark enough for the star to be visible. Since the ‘apparent’ phenomena are the only ones which can actually be seen, it seems clear that they are the phenomena referred to in the majority of literary texts and parapegmata; references to the ‘true’ phenomena, which cannot be seen and whose dates cannot be ascertained without mathematical or mechanical assistance, are obviously of less practical use and tend to be confined to ancient handbooks on astronomy."

True Morning Rising (TMR) (true) cosmical rising
the star crosses the eastern horizon with the sun: for the previous few days it had crossed the eastern horizon after sunrise (and was thus invisible); on the day of the true morning rising, it was below the horizon shortly before sunrise (and thus was invisible), and will remain invisible as it crosses the horizon (as the day has now dawned and the sun’s light obscures that of the star).

Apparent Morning Rising (AMR) heliacal rising ‘first visibility’
the star crosses the eastern horizon shortly before the sun, and is thus briefly visible (for the first time). With every morning that follows, the interval between the star’s rising and sunrise increases: the star is visible earlier, and for longer. This is the first of many visible risings.

True Morning Setting (TMS) (true) cosmical setting
the star crosses the western horizon as the sun crosses the eastern horizon: for the previous few days, the sun had risen before the star had set, and so as day dawned the star could be seen some distance above the western horizon.. On the day of the true morning setting, the star was visible before sunrise, but its setting is obscured by the light of the rising sun.

Apparent Morning Setting (AMS) (visible) cosmical setting
the star crosses the western horizon just before the sunrise, and so can be seen to set (for the first time) in the morning twilight. With every morning that follows, the interval between the star’s setting and the sunrise increases: this is the first of many visible settings.

Apparent Evening Rising (AER) (visible) acronychal rising
The star crosses the eastern horizon just after sunset. On previous days the star had crossed the horizon some time after sunset, and so its rising was easily visible. On subsequent days the interval between sunset and the star’s rising diminishes, and the sky is too bright for the star’s rising to be seen, and by the time the sky is dark the star is already some distance above the eastern horizon. Thus the apparent evening rising is the last visible rising of the star after sunset.

True Evening Rising (TER) (true) acronychal rising
the star crosses the eastern horizon as the sun crosses the western horizon, and is thus is invisible. By the time the sky is dark enough for the star to be seen, it will have already risen and be some distance above the eastern horizon.

Apparent Evening Setting (AES) heliacal setting ‘last visibility’
The star crosses the western horizon shortly after sunset. On previous days the star crosses the western horizon some time after sunset, and so it could be seen for some time in the night sky and it setting was easily visible. This is the last visible setting of the star, as on subsequent days the star will have disappeared under the horizon by the time the sky is dark, and so will be invisible.

True Evening Setting (TES) (true) acronychal setting
The star crosses the western horizon with the sun: by the time the sky is dark enough for stars to be seen, the star is beneath the horizon and so is invisible.
-----------------------------
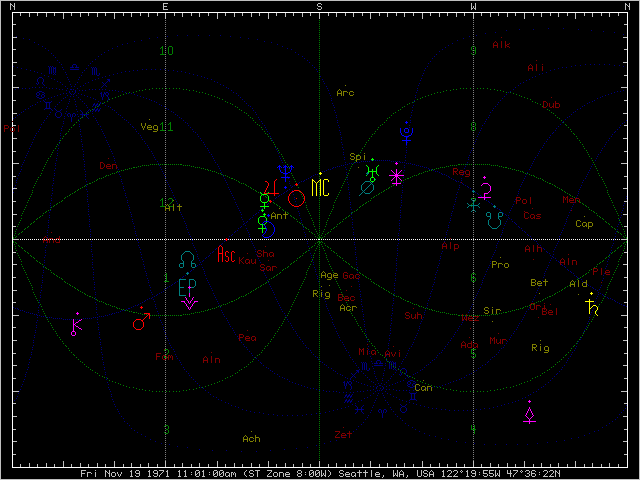
On a side note, Sky & Telescope offers an interactive sky chart for your location.
The map includes the Moon, stars brighter than magnitude 5, the five bright planets (Mercury, Venus, Mars, Jupiter, and Saturn), and deep-sky objects that can be seen without the use of optical aid.
Change the horizon view by dragging the green square on the full-sky chart.
Customize your map to show (or not show) constellation lines, names, and boundaries, deep-sky objects, star and planet names, and more. They offer the option to turn off the Sun, in order to show which stars are up during the daytime.
https://skyandtelescope.org/observing/i ... sky-chart/

Posted: Wed Oct 05, 2022 10:19 am
by Petr
Yes Martin, I have spent a lot of time on this issue. The problem with Alcyone's program is that it uses outdated ephemerides and only uses one variable to set all the previously mentioned constants and that is critical altitude. The results are different in some cases by months. Especially if the planet has a large magnitude range. So the comparison works best for Venus. The problem is that Arcus Visionis is calculated for the position of the planet on the horizon, as Ptolemy stated, and the data from K.Schoch are taken as the basis of the tables. The author of the PLSV program, Professor Swerdlow himself, states in the program documentation:

Summary remarks. The calculation of visibility phenomena is plagued by uncertainties that will only be resolved by a body of reliable observations that does not yet exist. We have done our best to provide flexible methods of computation based upon the arcus visionis, either fixed or variable, with all parameters adjustable individually for each planet and star. In addition, the critical altitude for visibility is adjustable for each planet separately and for each star separately or for all stars together. It appears from trial calculations that changes in the critical altitude produce greater differences in the dates of phenomena than reasonable changes in the arcus visionis, so the critical altitude must be set with great care. The user is encouraged to experiment with different parameters to find which appear to produce the most accurate, or most reasonable, results, although in the absence of reliable observations for comparison, it is difficult to say what most accurate or most reasonable is.

So we have a tool, but we can't actually judge its results without a series of observations. The basis is the 1927 tables of Schoch, who determined the parameters by evaluating values obtained from the writings of ancient Babylonian astronomers and made some independent measurements in Berlin, about the conditions of which not much is known.
In fact, the only extensive observation is the work of Rumen Kolev, who made measurements between 1998 and 2007. Based on these measurements, he then determined the algorithms for the calculations, the helicity phases in the program Porphyrius Magus 2.
As I wrote the problem is the definition of Arcus Visionis.
The PLSV is designed with respect to the values that have been established by Schoch. These values are essentially slightly modified and extended values left to us by Ptolemy. So we have to ask how Ptolemy worked. This subject has been the subject of scholarly work by several astronomers. The result was the discovery that only part of the values given were obtained by observation. Much of it was calculated. Another very interesting result of these studies is that all the values were corrected for extinction and azimuth. It has not been possible to find out how Ptolemy, but also for example Tycho de Brahe, corrected the values. Whether he knew an algorithm or made a guess.
Arcus Visionis is therefore a calculation for the position of the planet directly on the horizon at a certain value of the altitude of the Sun below the horizon.
When we actually observe the phase of a planet, we find that it must be at a certain height above the horizon in order to see the planet. Our task, therefore, is to determine the basic height of the Sun below the horizon and the critical height of the planet above the horizon so that the phenomenon can be recorded with certainty. In his many years of observation, Rumen Kolev has determined the optimum values for the position of the Sun below the horizon to determine the phases. The values depend on the brightness (magnitude) of the planet and its azimuthal distance from the Sun. Kolev calls them standard. For example, for azimuth differences of less than 50°:

Magnitude AV Sun standard
-5.0 to -3.5 -4°
-3.5 to -2.3 -5°
-2.3 to +0.0 -7°
+0.0 to +3.0 -9°

These values will replace the constants in the basic PLSV settings. It remains to determine the critical altitudes of the planets in their phases. This is the most important and most problematic part of the setup. In the critical altitude we have to include a magnitude-dependent planet coefficient, a correction for the required extinction and a correction for the azimuth. Unfortunately, there is no simple linear equation to calculate the required critical altitude due to the large variability in magnitude and the variable extinction and azimuth correction factors, which are also dependent on the magnitude of the planet. The situation is further complicated by the fact that the ephemerides used in the PLSV program are outdated and do not correspond to current knowledge. I assume that the calculation algorithm is similar for both PLSV and Kolev.
I did various comparisons of results between Delphic Oracle, Zeus, PLSV and Porphyrius Magus 2.
For comparison I took the MF Venus phase for Brno, Czech Republic in 2018. For the standard PLSV setting I got the date 2.11.2018. The same comes out for Porphyrius Magus 2.
Venus, of course, gives us the best results. However, Zeus calculates on November 4, 2018 and Delphic Oracle on November 5, 2018.
Unfortunately, for other planets with larger magnitude changes, the comparison is not so optimistic.
For example the EL phase for Saturn in 1908, Litvinov, Czech Republic. PLSV gives the value 7.3.1908.
Porphyrius Magus 2 for an extinction coefficient of 0.16 gives 28.2.1908. For an extinction coefficient of 0.26 it gives 26.2.1908.
Delphic Oracle gives an EL value of 4.3.1908 and Zeus 25.2.1908.
The biggest problem arises with Mercury due to the uncertainty of its size near the Sun. No reliable algorithm is yet known for calculating Mercury's magnitude. Unfortunately, the PLSV program uses the old G algorithm. Müller AA 1984. The newer AA 1984, AA1992 and Hilton 2005/AA 1992 (listed in Alcyone Ephemeris) give widely different results. Kolev used the more modern ephemerides and the 1927 Schoch algorithm to calculate Mercury. The latter gives us the value of Mercury's magnitude for phase angles less than 40° according to the equation
Mag. = -3 + 0.0385 x phase angle.
Kolev goes on to say that Mercury's magnitude is wrongly determined in most programs, it does not correspond to the measurements at the observatories.
It is impossible to describe in brief the amount of work I have done in comparing these programs.

Posted: Wed Oct 05, 2022 11:22 am
by Martin Gansten
Thank you for that very full and informative answer, Petr. It seems a real mare's nest. It's surprising, in a way, that some parts of the cycles that the planets form with the sun (their stations and retrogression) should be so easy to find out using even the most basic astrological software, while others that are equally important (heliacal risings and settings) seem near-impossible to get right. In any case, it is useful to know the state of things, so thanks again.

Posted: Wed Oct 05, 2022 11:30 am
by Ouranos
Thank you Petr,

So many factors involved. But so basic at the same time.

How reliable is ke!san Online Calculator ?
https://keisan.casio.com/exec/system/1224767453

Posted: Thu Oct 06, 2022 1:50 am
by Cruiser1
Image
Image
Image
Martin Gansten wrote:Can it also produce a table/list of dates in simple text format, like Alcyone, for us left-brainers? ;) I confess I find the multicolour graph unintelligible (it doesn't communicate anything at all to me 'in a glance', whereas a text table does).
Yes, Astrolog can also calculate exact rising and setting times for planets and stars, and display them as a text list (and accurately, such that it takes into account atmospheric refraction and your elevation above sea level). That can be used to determine planet visibility, such as checking time ranges after the Sun sets and before it rises, and seeing how they overlap time ranges between where a planet or star rises and sets.

The multi-color planet visibility graphs of Astrolog and Alcyone are very informative, once one understands what they're doing. For example, start with the first image above, in which date is on the vertical axis, and time of day is on the horizontal axis. Red areas are where the Sun is visible or above the horizon, and black is where the Sun is below it. The bulge in summer months is because days are longer at the chart's Northern latitude. One can easily see that the year's earliest sunrise is around June 16th at about 5:16am, and the latest sunset is around June 25th at about 9:05pm.

Now add Venus to the picture (second image above) in which Green is where Venus is above the horizon (and Yellow or Red+Green is where both the Sun and Venus are above the horizon at the same time). That means Venus is visible in the Green areas of time (in which Venus is above the horizon = Green, and Sun is below the horizon = not Red). Where Green meets black is where Venus rises/sets and is on the boundary of being visible, and where Green meets yellow is where the Sun rises making Venus no longer visible. The best viewing of Venus is in the middle of widest Green bands, in which Venus is most significantly above the horizon, and the Sun is most significantly below it.

Astrolog also allows you to consider three bodies at once, in which Red=body1, Green=body2, and Blue=body3. The third image above has Red=Sun, Green=Venus, and adds Jupiter=Blue. This creates additional types of overlap, e.g. Cyan or Green+Blue is where Venus is above horizon AND Jupiter is above horizon AND Sun is below horizon. See the legend at the bottom of the chart for the eight different color combinations of the three planets each being visible or not visible. The best viewing of both Jupiter and Venus at the same time is in the middle of wide Cyan bands, in which Venus and Jupiter are both significantly above the horizon, and the Sun is significantly below it.
Martin Gansten wrote:Perhaps more to the point, do you know if Astrolog and Alcyone agree in their output, or, if not, how great the differences are and what causes them?
Yes, Astrolog and Alcyone are very similar in their output. Astrolog is more accurate due to it using the latest version of Swiss Ephemeris, and also because Astrolog takes into account elevation and atmospheric refraction. However, the additional accuracy of those components is relatively small, e.g. atmospheric refraction will only move planets up to half a degree. (However, half a degree can still be significant, especially near the poles when planets may move close to the horizon for a longer period of time.)

Posted: Thu Oct 06, 2022 7:23 am
by Martin Gansten
Cruiser1 wrote:The multi-color planet visibility graphs of Astrolog and Alcyone are very informative, once one understands what they're doing.
I'm sure. For me, though, it's like saying that an article written in Mandarin is very informative once one masters Mandarin. I'm probably near the verbal extreme of the visual/verbal learning spectrum. :D The first thing I do after installing any astrology software is to switch off the colours!
Yes, Astrolog and Alcyone are very similar in their output.

Right. Given what Petr said in his latest post, that is not necessarily a good thing, but it's useful to know.

Posted: Thu Oct 06, 2022 9:55 am
by Ouranos
Thank you Cruiser1,
Great information to read these graphs.

However, I will come back to the site In-The-Sky.org
Back to the calendar October 2022 (example for Montreal, Canada)
https://in-the-sky.org/newscal.php?year=2022&month=10

Oct 22, I click on Venus at superior solar conjunction
On top of the page you have the date and time of the conjunction for a specific location
At the bottom of the page in Related news, I click on the earliest date prior to Oct 22 which is
20 Mar 2022 - Venus at greatest elongation west for the current phase. 3 May 2023 - Venus at highest altitude in evening sky for the next set of dates and times
And there, you have all the information you need with dates and times.
- The 2022 morning apparition of Venus with brightness, altitude, elongation, dichotomy (the appearance of a half illumination phase as seen in a telescope. It can occur as much as a week later than the maximum elongation for Venus)
- The altitude of Venus at sunrise over the course of the apparition, direction, magnitude and Phase
- Graphs available
- Apparitions of Venus and observations.
-----------------
They use the DE430 planetary ephemeris published by the Jet Propulsion Laboratory (JPL).
Asteroid positions are computed from orbital elements made available by Ted Bowell at the Lowell Observatory.
Comet positions are computed from orbital elements published by the Minor Planet Center.
Star positions and magnitudes are taken from Hipparcos, Tycho, Tycho-2 and Gaia EDR3 catalogs.

What I like about this calendar is some astronomical facts mentioned like the lunar occultation of Uranus by the Moon on Oct 12, visible for most of North America. It is like an eclipse of Uranus. Curious to see how this will unfold.

Posted: Thu Oct 06, 2022 4:47 pm
by Martin Gansten
Ouranos wrote:However, I will come back to the site In-The-Sky.org
Back to the calendar October 2022 (example for Montreal, Canada)
https://in-the-sky.org/newscal.php?year=2022&month=10
I like the look of this, but I couldn't find a way of finding out whether or not a particular planet was visible at a given location many years ago (say, 1972). Is there a way to do that?